Earlier this month (Oct 2018), Phillip Securities introduced a brand new ETF - the Phillip SING Income ETF, to be managed by Phillip Capital Management, Based on the name of the ETF alone, it's easy to guess the focus of this ETF: dividend income, which is an investment style popular amongst retail investors in Singapore.
Here's how the ETF is described on poems.com.sg:
Harvest Your Regular Income with Phillip SING Income ETF
The Phillip SING Income ETF focuses on 30 high quality Singapore Listed stocks to offer investors a cost-effective and diversified exposure to the Singapore market. By using a rule/factor-based approach for stocks selection, the ETF aims to deliver stable and quality income for investors.
The Phillip SING Income ETF provides investors with:
- Easy access to 30 high quality Singapore Listed Stocks
- Liquidity, transparency and diversification across the Singapore market
- Stable and quality income with semi-annual dividend distribution
- Strategic Beta for stocks selection with emphasis on
- Business Quality
- Financial Health
- Dividend Yield
Here's a compilation of articles written by various sources on this ETF:
In this post, I will be doing my analysis on this ETF and evaluate the potential role it can play in my portfolio.
Comparison to other Singapore exposure-only ETFs on SGX
One of the first questions to ask when evaluating new ETFs is how this new ETF compares with existing ETFs on the exchange. For context, there are plenty of ETFs listed on the SGX, and there are 7 of them that are specific to gaining Singapore exposure:
- O9A.SI - Xtrackers MSCI Singapore UCITS ETF
- CLR.SI - Lion Phillip S-REIT ETF
- G3B.SI - Nikko AM Singapore STI ETF
- ES3.SI - SPDR Straits Times Index ETF
- A35.SI - ABF Singapore Bond Index ETF
- MBH.SI - Nikko AM SGD Investment Grade Corporate Bond ETF
- KV4.SI - Xtrackers II Singapore Government Bond UCITS ETF
Of these 7,
- 3 of them (A35, MBH, KV4) are fixed income ETFs
- 1 (CLR) is a REIT ETF
- 2 of them (G3B, ES3) are essentially the same (both tracks the STI).
Hence those valid for comparison are:
- O9A.SI - Xtrackers MSCI Singapore UCITS ETF
- Either of the STI ETFs
Underlying indices and their constituents
The STI is, well, the flagship index for the SGX, and tracks the top 30 stocks (by market cap) listed on the SGX. O9A, on the other hand, tracks the MSCI Singapore Index, and the Phillip SING Income ETF will be tracking the Morningstar Singapore Yield Focus Index.
The Morningstar Singapore Yield Focus Index
A brief note on the historical performance of the Morningstar Singapore Yield Focus Index (MSYF) - the index has delivered an annualized return of 9.6% since 2005, which can be broken down into capital gains of 5.2% and dividend returns of 4.4%. Bear in mind that the this period also includes the 2007-2008 financial crisis.
The key feature of the MSYF is the avoidance of dividend traps - stocks that generate high yield and yet have weak fundamentals. This is done by the index construction process of the MSYF. I won't be covering the math part of it here, because even just by eyeballing the index, we can tell what it can do for us.
Smart Beta ETF
One thing to point out here is that the Phillip SING Income ETF is a classic example of a Smart Beta ETF. Unlike a typical market cap-weighted index ETF, a Smart Beta ETF usually relies on rules, such as the MSYF index construction rules, to lay out parameters to build the ETF, so as to beat the beta. Once these rules are constructed, the ETF is autonomously functional - hence Smart Beta ETFs are typically regarded as semi-passive ETFs.
Top 10 holdings
Following is how the indices differ in top 10 holdings.
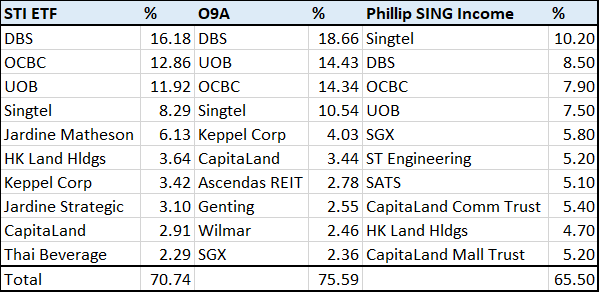 Top 10 holdings of respective indices
The first thing you should notice is that the top 4 holdings of the three indices are the same, albeit in different order. DBS, OCBC, UOB, and Singtel all feature in the respective top 4. The STI is well-known to be overweighted in our local banks (40.96%), which is similar for the MSCI Singapore Index (47.43%). Whether it's good for an index to be overweighted in banks is another topic all together - however what's refreshing here is that the banks take up only 23.9% of the MSYF.
This is the first key characteristic for lay investors like us to consider: the MSYF has a hard cap of 10% per stock. To me, this is biggest upside of this ETF - an ETF on SGX that's not overweighted in banks.
Full holdings and sector distribution
Following are the full holdings of each index.
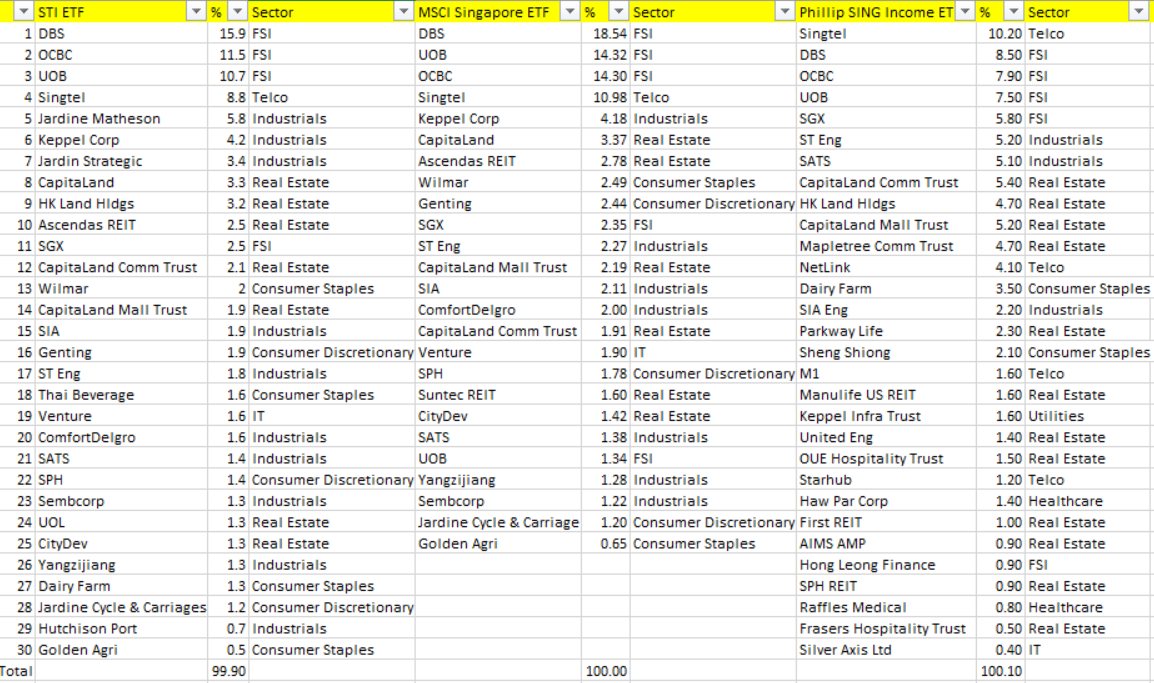 Full holdings of respective indices
And here are the sector distributions.
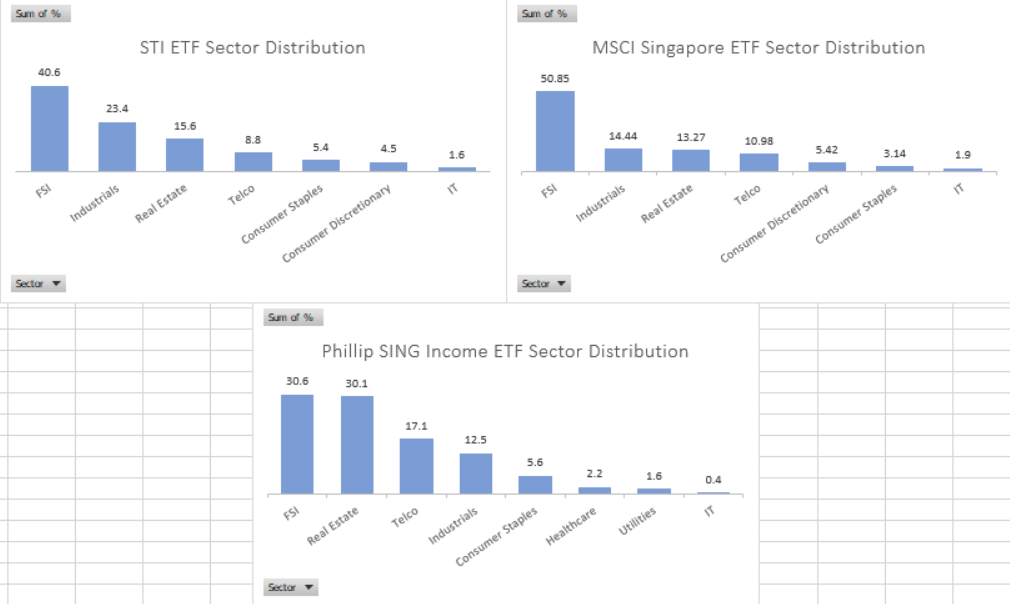 Sector distributions of respective indices
Again, just by eyeballing, what catches my lay investor's attention immediately is the 30.1% representation of real estate (mainly REITs) in the ETF. Personally, I like S-REITs as dividend generating vehicles, but neither STI nor the S-REIT ETF can offer a diversified and cheap solution to gain REITs exposure in Singapore (the S-REIT ETF is pretty expensive with a 0.6% expense ratio).
Dividend yield and expense ratio
Of course, two important things that must be considered for an ETF are the dividend yield and expense ratio.
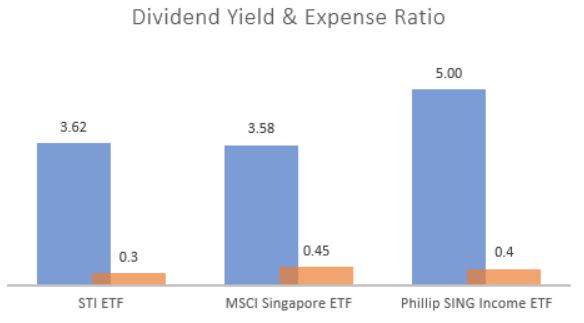 Dividend yields and expense ratios of respective indices
For the Phillip SING Income ETF, both 5% yield and 0.4% management fees are indicative numbers given by the fund managers as the most probable. If both numbers come true, this would be another plus point for this ETF - competitive fees with superior yield. The 5% indicative yield comes from the fact that there is a combined 60% of banks and real estate in the ETF.
What to think about when the ETF starts trading
- Tax transparency: something that I didn’t thought about previously, so quoting the article from The Fifth Person here - “Distributions from S-REITs are tax-free for investors. From 1 July 2018, this tax transparency treatment was also extended to ETFs invested in S-REITs. Previously, distributions from S-REITs to ETFs were taxed at 17%, which made investing in S-REIT ETFs tax inefficient. However, this treatment only applies to ETFs that invest entirely in REITs (like the Lion-Phillip S-REIT ETF). The Phillip SING Income doesn’t qualify for tax transparency as it invests in other securities besides REITs. Phillip Capital Management plans to speak to the authorities about extending the tax transparency treatment to any ETF that invests in REITs, but for now the dividend yield for the Phillip SING Income ETF is effectively 4.8% after factoring the 17% withholding tax on S-REIT distributions.”
- Tracking error: Tracking error matters for an ETF: the closer the ETF is to its target index, the better. Since the ETF has not began trading, it remains to be seen whether tracking error will be acceptable.
- Inclusion into Regular Savings Plan: since this ETF is managed by Phillip, you can be sure that it will be included into the POEMS SBP, potentially even the POSB Invest-Saver. Something for the DCA-ers like myself to think about.
Conclusion
My take is that the Phillip SING Income ETF is a superior alternative to the STI ETF, given the
- Non-overweightage of banks
- Hard cap of 10% per stocks
- 30% representation in REITs
- Reasonable fees of 0.4%
- And that sweet, sweet 5% yield if it comes true
Therefore, I have participated in the subscription of this ETF, putting in a few grand, and potentially including it into my DCA if it turns out well.
The Phillip SING Income ETF will go live on the SGX on 29th Oct 2018.